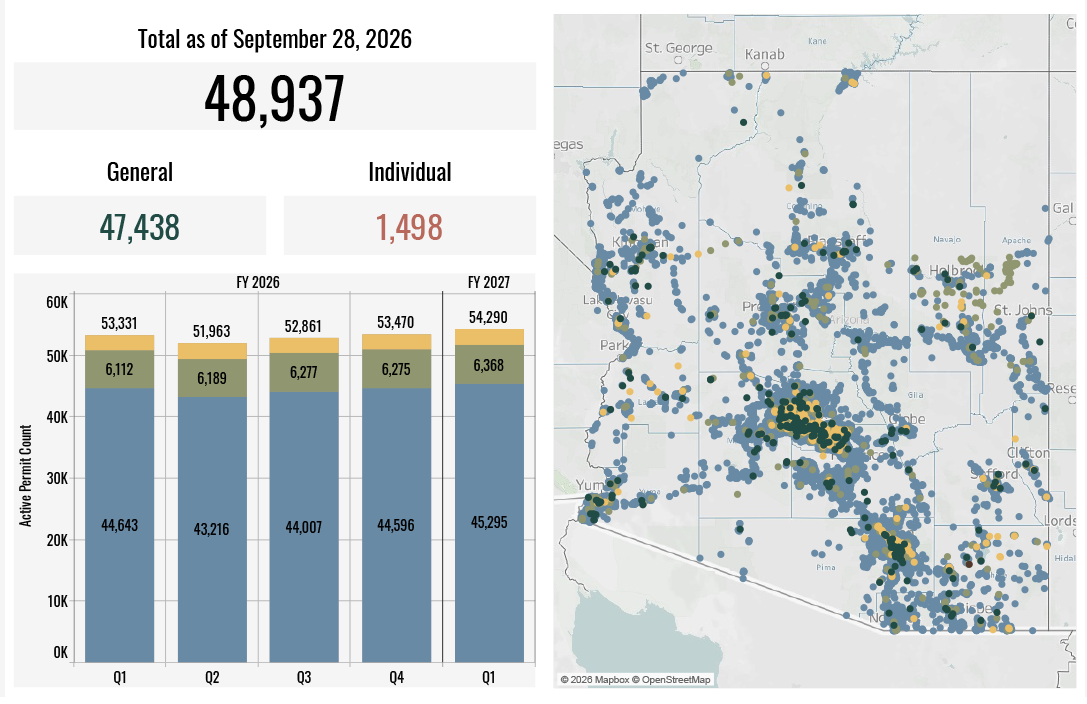
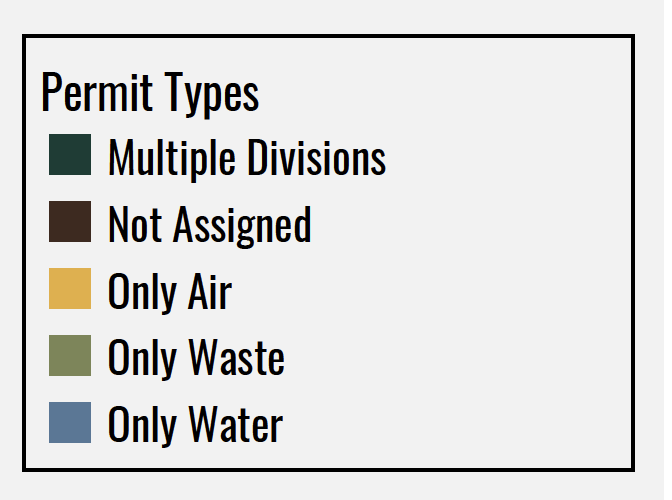
Shows active individual and general permits and licenses issued by fiscal-year quarter and is updated monthly. To see the graph and map in greater detail, click the image or | Download PDF >
Color Key:
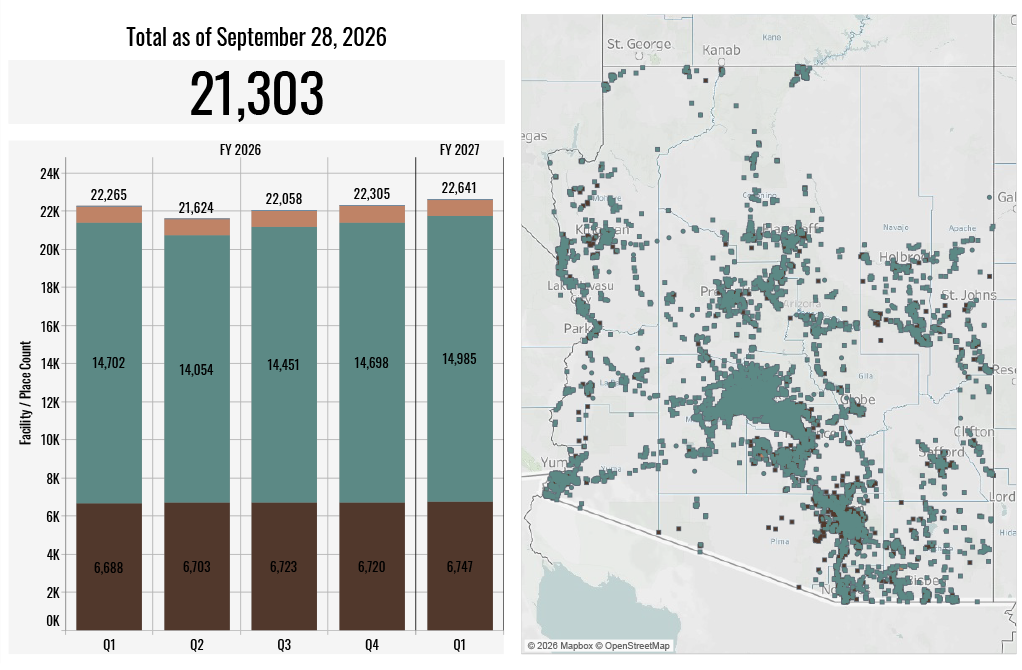
Shows active regulated facilities by fiscal-year quarter and is updated monthly. To see the graph and map in greater detail, click the image or | Download PDF >
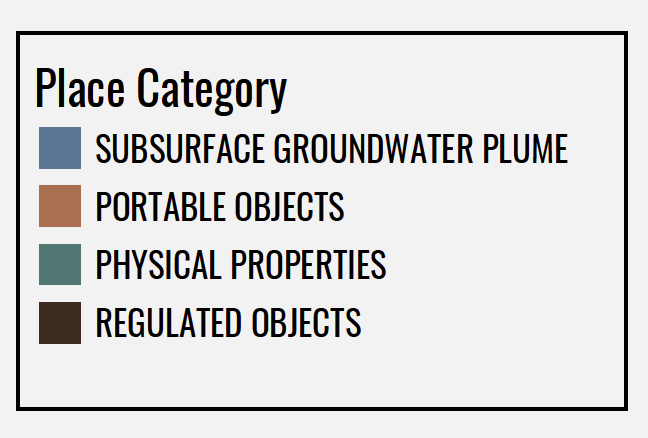
Color Key:
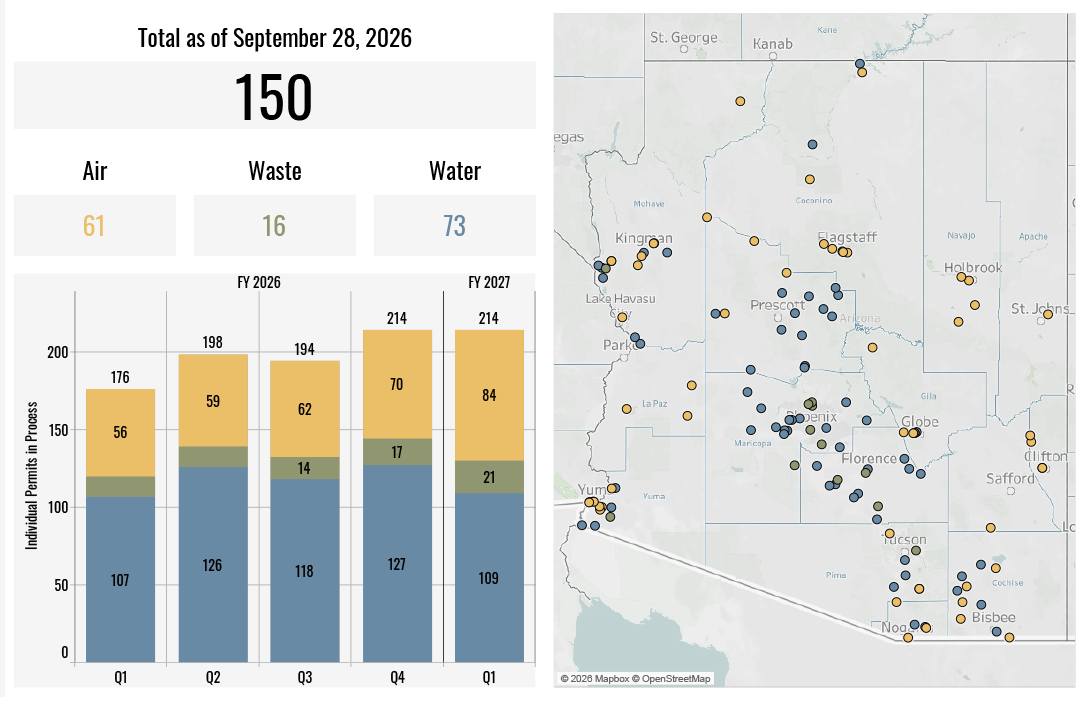
Shows active individual permits and licenses in process by fiscal-year quarter and is updated monthly. To see the graph and map in greater detail, click the image or | Download PDF > | View this Month's PIP Report >
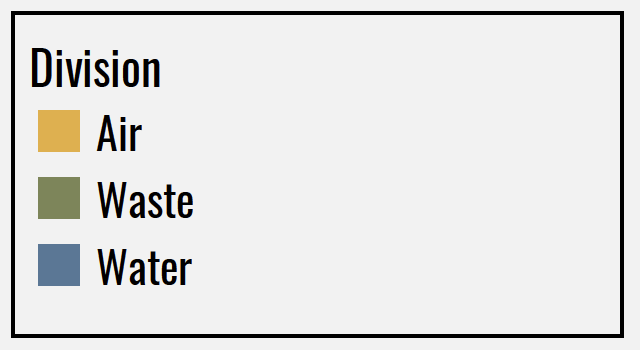
Color Key:
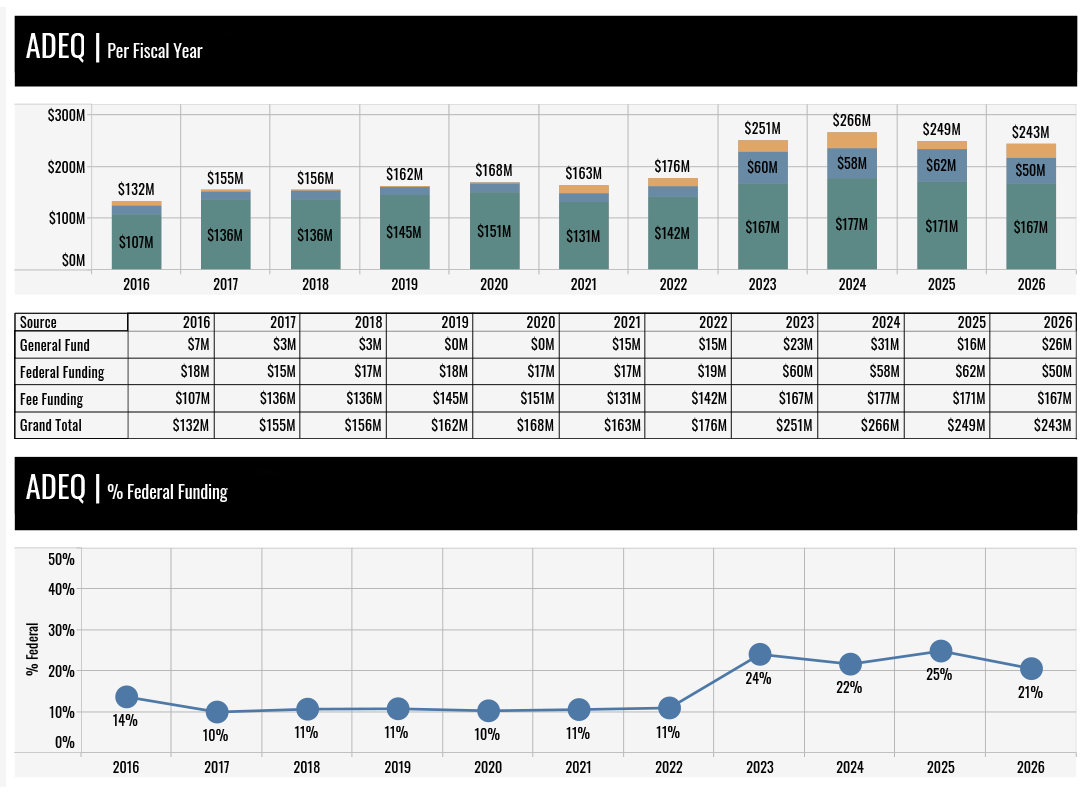
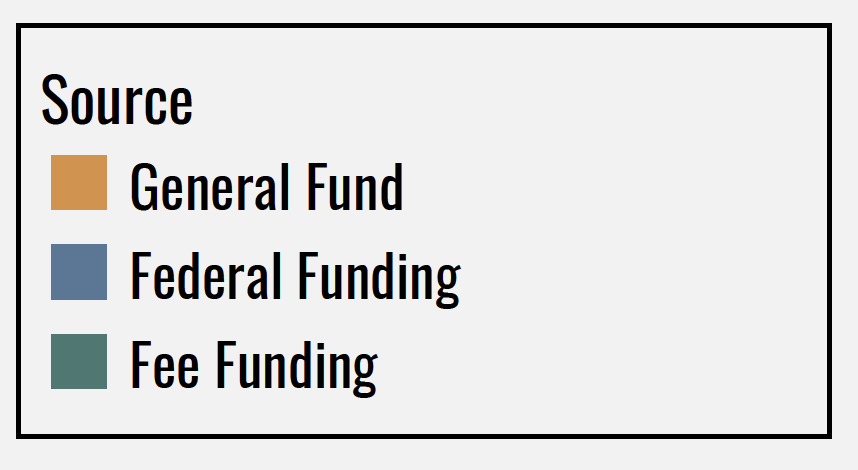
Shows ADEQ's fiscal-year funding by source and is updated annually. To see the graph and map in greater detail | Download PDF >
Color Key:
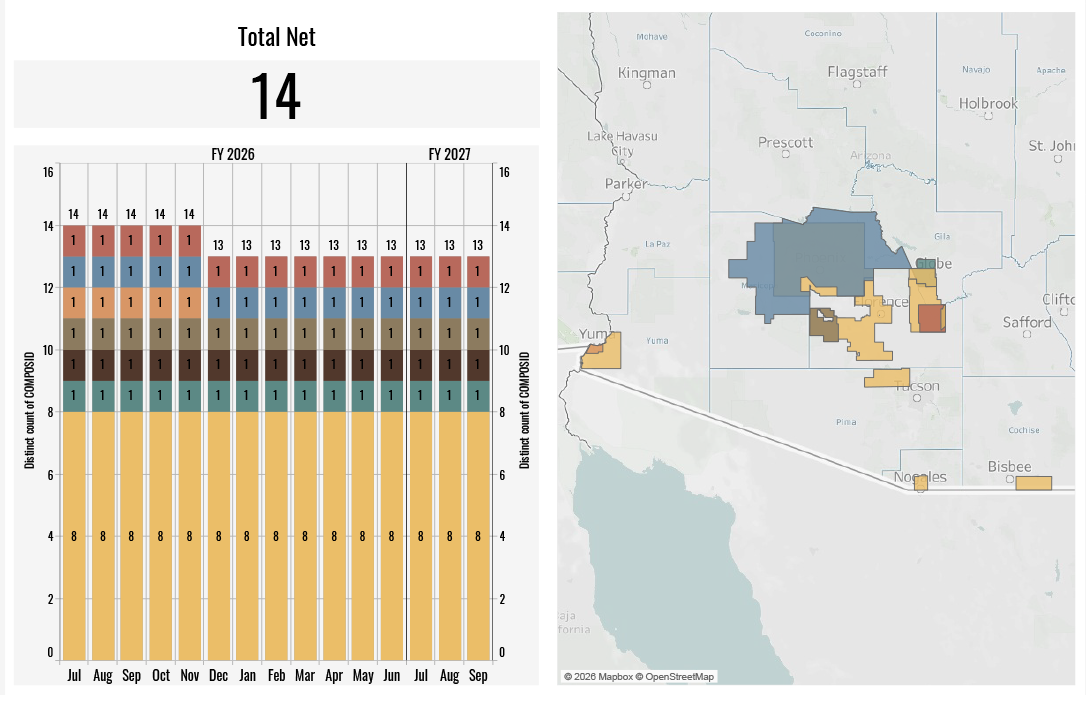
Shows airsheds in non-attainment status by fiscal year and is updated monthly.
A non-attainment area is a distinct geographic area where criteria pollutants are above the acceptable levels defined by the National Ambient Air Quality Standards (NAAQS) set by the U.S. Environmental Protection Agency (EPA) under the Clean Air Act | Learn More >. To see the graph and map in greater detail | Download PDF >
Color Key: